Webinar: Bringing EDS to life: sample considerations for biological element analysis – October 2nd!

Oxford Instruments webcast


The MCF will broadcast this webinar on the monitor in the lobby of the MCF in the Marcus Nanotechnology Building.

It will be streamed on Wednesday, October 2nd from 11:00AM-12:00PM. If you would like to watch it at your own computer, you can register for the webinar here!

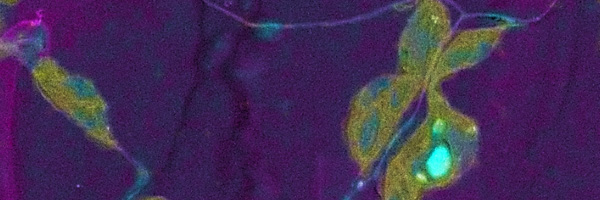
Energy dispersive X-ray spectrometry (EDS) provides biologists with colourful element-based compositional information in addition to greyscale ultrastructural data produced with standard electron microscopy (EM), aiding the correct identification of structures and labels. A crucial aspect of all biological EM, including EDS, is the preparation of specimens with the aim of preserving and imaging samples as close to their living state as possible. The best option is freezing samples rapidly and imaging them in their frozen-hydrated state. However, the samples are sensitive to the electron beam requiring low dose imaging methods to avoid damage, and the low contrast makes identification of ultrastructure difficult. Chemical fixation allows the addition of contrasting agents and provides greater stability in samples, but prolonged preparation techniques may result in changes to ultrastructure and potential extraction of elements.

In this webcast, the speakers will discuss the challenges of biological EDS and provide information about sample preparation methods and imaging conditions in order to maximise results — from traditionally prepared samples to unstained specimens to cryo-electron microscopy of vitrified samples (CEMOVIS) — to identify and image cell ultrastructure in both transmission and scanning electron microscopy.


Atom Probe Tomography for Atomic Scale Characterization and Biomaterials Analysis

The MCF will be hosting a lecture on Atom Probe Tomography with scientists from Cameca on Wednesday, September 11, 2019 from 12:00 PM to 1:00 PM EDT .

This talk will cover APT operational theory, an introduction to sample prep and data reconstruction, and an overview of various applications. A commercial cryo-UHV solution for FIB-APT specimen transfer will also be presented.

Atom Probe Tomography Schematic


If you would like to sign up, you can you do so here!


A Day In The Life of an XRD!

The Malvern PANalytical Empyrean in the MCF was featured prominently in a story recently posted online!

Many thanks to Neha Kondekar and Xenia Wirth as well as the MSE 2021 class for agreeing to participate!

If you would like to see the blog post, you can see it here!

The core facility for materials analysis at Georgia Tech is the IEN/IMat Materials Characterization Facility (MCF). The MCF is available to academic, industry and government users; it merges several labs on Georgia Tech’s campus and offers a variety of microscopy and characterization tools as well as skilled research staff to support research needs. Offering 24-hour a day shared-user access to the latest in imaging and analysis technology, and operated on a fee rate schedule, the MCF facility provides services for researchers including equipment training, remote sample prep and measurement, and imaging and analysis consultations.

MCF also happens to be where this top public research university and institute of technology houses their Malvern Panalytical Empyrean X-ray diffraction (XRD) instrument. The Empyrean XRD system generates X-rays, directs them toward a sample, and collects diffracted rays (the angle between the incident and the diffracted beam). Collected data are widely used for the identification of unknown crystalline materials (e.g. minerals, inorganic compounds), quantification of crystalline and amorphous materials, thin film thickness and structure, and many more applications. These applications are critical to studies in geology, environmental science, material science, engineering and biology.


MCF is extending its Raman and PL capabilities to Deep UV with a new stand alone Renishaw system

  • Extremely high efficiency 250 mm focal length inVia Reflex spectrograph
  • Stand alone Renishaw Raman unit with solid-state Deep-UV laser (266 nm) and components
  • UV optics for high temperature and high power electronics.
  • Capability for Raman and PL spectroscopy from 200 nm – 1700 nm with automated mapping.
  • Andor InGaAs detector.
  • Ability to measure spectra of photonic materials deep into the UV range (e.g. AlxGa1-xN with up to 75% Al) including materials of Ultra-Wide Bandgap Initiatives.
  • Confocal Raman measurements with different Bright Field objective options
  • Different Grating options include 600 l/mm (NIR) & 3600 I/mm(UV)


Enter the EnvisioNano Image Contest! Deadline Dec 31, 2018!

EnvisioNano is a contest for undergraduate and graduate students conducting nanotechnology research in the United States and U.S. territories. Students should submit striking nanoscale images that demonstrate how beautiful the nanoscale can be alongside thoughtful, concise descriptions of the research behind the picture and how it may lead to nanotechnologies that benefit society. The goal is to envision where your research is headed and explain how “seeing” at the nanoscale is important to reaching that vision.  See the most recent winning image here!

For details and submission guidelines, please go here: https://www.nano.gov/EnvisioNano

December 2018 Image Contest is Live!

The December Image Contest is live and you can submit your images here!

If you have questions about the submission guidelines for the contest, those can be found on our website here.

And if you would like to see our previous winners (and congratulations to our winners in September and October), those images can be found here. The winner of the November contest will be posted by the end of this week.

If you have questions or concerns, please feel free to contact MCF Staff.

Webinar – How is Particle Size Measured

Masterclass
October 23
10:30 ET
The MCF will be showing this webinar on the monitor in Marcus at 10:30AM on October 23rd.
—-
There is a gamut of particle size distribution measurement techniques each with established history and advantages.

The killer word in particle size distribution is the last one (distribution) and measurement of broad distributions is the bane of all sizing techniques.

After a very short introduction to ‘how much sample should we measure to describe the distribution’, we’ll be running through the background of some of the more popular techniques (sieves, sedimentation, electrical-sensing zone) and will emphasize the popular light scattering techniques of laser diffraction and dynamic light scattering.

As an aside, we’ll be mentioning Small-Angle X-ray Scattering (SAXS).

MCF Image Contest for October

The image contest for the October is now live and you can submit your images here!

If you have questions about the submission guidelines for the contest, those can be found on our website here.

And if you would like to see our previous winners, those images can be found here.

If you have questions or concerns, please feel free to contact MCF Staff.