Chromatography separates molecules according to their size and/or mass and in the process display a spectrum showing the distribution of different molecular species in a compound or mixture. The OMCL has gas chromatography-mass spectrometry (GC/MS), liquid chromatography-mass spectrometry (LC/MS), and size exclusion chromatography (SEC/GPC) capabilities.
[expand title =”Size-exclusion chromatography or Gel-permeation chromatography (SEC or GPC)”] is a chromatographic method that separates molecules by their size. It is a widely used polymer characterization method because of its ability to provide good molar mass distribution (Mw). The Tosoh EcoSEC in the OMCL uses chloroform as the mobile phase and a column packed with fine, porous polymer beads as the stationary phase. The pore sizes of these beads are used to estimate the dimensions of macromolecules and polymers in the sample. As the solution travels down the column some particles enter into the pores. Larger particles cannot enter into (as many) pores resulting larger molecules can therefore flow through the column more quickly than smaller molecules, that is, the smaller the molecule, the longer the retention time.
It is important to note that it is the hydrodynamic volume of the polymer molecules (not the mass) that is measured. In other words, SEC determines how much space a particular molecule takes up when it is in solution. SEC can also be used to determine the polydispersity of polymers, i.e., the distribution of the sizes of polymer molecules. The approximate molecular weight of the sample can then be calculated from the instrument’s calibration curve. We calibrate our instrument using polystyrene standards of known sizes dissolved in chloroform. The relationship between hydrodynamic volume and molecular weight is not the same for all polymers, so only an approximate measurement can be obtained using this method.
The Tosoh EcoSEC has an integrated refractive index (RI) detector, which is the most common GPC detector. The detector responds to a change in refractive index, and measures the deflection of a light beam from the difference in the refractive index between pure solvent and solvent with sample. RI detectors are not as sensitive as some other detectors and they are affected by changes in environmental conditions, they high solvent quality for stable baselines. In addition to the RI detector, we also have Multi-Angle Light Scattering (MALS) and viscosity detectors from Wyatt. SEC-MALS has the advantage that it can be used for absolute characterization of molar mass, size conformation, radius of gyration, and potentially conjugation ratio. It measures the light scattered by the sample and its angular dependence and, therefore, does not need to assume that the analyte elutes in accordance with the polystyrene standards used to make the calibration curve.[/expand]
[expand title =”Liquid chromatography”] is a technique used to separate a sample into its individual parts. This separation occurs based on the interactions of the sample with the mobile and stationary phases. Components within a mixture are separated in a column based on each component’s affinity for the mobile phase. So, if the components are of different polarities and a mobile phase of a distinct polarity is passed through the column, one component will migrate through the column faster than the other (i.e., it will have a shorter retention time). Because molecules of the same compound will generally move in groups, the compounds are separated into distinct bands within the column. As the mobile phase passes through the column, the two components (red and blue in image below) begin to separate into bands. The red component has a stronger affinity for the mobile phase and the blue for the stationary phase.
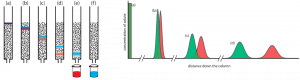
(left) Progress of a column chromatographic separation of a two-component mixture. In (a) the sample is layered on top of the stationary phase. As mobile phase passes through the column, the sample separates into two solute bands (b–d). In (e) and (f), we collect each solute as it elutes from the column. (right) An alternative view of the separation in Figure 12.2.1 showing the concentration of each solute as a function of distance down the column. Reference: LibreTexts.
Our Agilent 1260 Infinity II/6120 Quadrupole LC/MS uses reverse-phase chromatography with a polar mobile phase (or solvent polarity gradient with the most polar solvent first and the least polar solvent last) and a non-polar stationary phase. When doing reverse-phase LC the most polar compounds in the sample solution will be eluted first, with the components following having decreasing polarities. Once the analytes have been separated, they are transferred to the mass spectrometer (MS) that produces a beam of gas ions from the sample and sorts the mixture of ions according to their mass-to-charge (m/z) ratios. From the output signal the m/z ratio and the abundance of each ionic species can be determined.
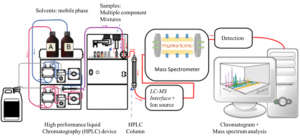 Diagram of a LC/MS system. Reference: Wikipedia.
[/expand]
[expand title =”Gas chromatography (GC)”] is a technique used to separate a sample into its individual parts. The separation occurs based on how the sample interacts with the mobile (we use helium gas) and stationary phases. Samples are introduced into the Agilent 8860 GC 5977 MSD using a heated injector and the analytes condense at the entrance of the column and are subsequently separated based on their molecular mass and polarity before they enter the MS. Each analyte will have a certain affinity for the mobile and the stationary phase. More volatile components elute first (i.e., they have a shorter retention time) as they are carried through the column by the carrier gas at lower temperatures. Increasing the oven temperature enables the transfer of compounds with higher boiling points from the stationary phase into the vapor phase and their elution from the column.
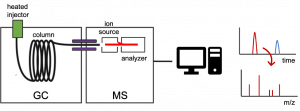
Diagram of a GC/MS system.
[/expand]
Infrared Spectroscopy involves the interaction of Infrared (IR) light with the molecules in the sample. The sample can be solid, liquid or gas. It is a technique mostly based on absorption Spectroscopy. The energy of the infrared photons induces vibrational excitation of covalently bonded atoms and groups. The different vibrational modes of the molecules (bending, stretching, scissoring, rocking and twisting) are characteristic and unique. Infrared Spectroscopy is wildly used to identify organic compounds and unknown polymers. (used a lot in forensic studies & reverse engineering materials). One primary selection rule that influences the infrared absorptions, is that a, change in dipole moment should occur for a vibration to absorb infrared energy. Absorption bands associated with C=O bond stretching are usually very strong because a large change in the dipole takes place in that mode. On the other hand molecular symmetry & spectrometer limitations decrease the intensity of the IR peaks.